
State of the Canadian Space Sector Report
On this page

The materials contained in this publication may be reproduced, in whole or in part, for non-commercial purposes, and in any format, without charge or further permission, provided you exercise due diligence in ensuring the accuracy of the materials being reproduced, you indicate the complete title of the publication, and you indicate that the reproduction is a copy of the original version. Commercial reproduction and distribution are prohibited without prior written permission from the Canadian Space Agency (CSA).
For more information on the contents of this report, please complete the CSA's information request form.
For more information on reproducing the materials in this report, please contact pitt-iptt@asc-csa.gc.ca.
© His Majesty the King in Right of Canada, as represented by the Minister of Innovation, Science and Industry, .
Cat. No.: ST96-8E-PDF
ISSN: 2369-6338
About this Report
In this section
Objective
The State of the Canadian Space Sector Report provides factual information about the Canadian space sector. The report, which is now in its 28th edition, is based on a questionnaire sent to companies, not-for-profit organizations, research centres and universities, and federal government with space-related activities in Canada.
To align with international practices, the publication is identified by the year in which the survey took place () but reports on data covering the year .
The base year of was selected for much of the trend analysis given that using anomaly years from the COVID-19 pandemic would provide misleading conclusions.
The organization-specific information used to compile this report remains strictly confidential and will not be released in any manner other than aggregate form. Consequently, in certain circumstances, a detailed explanation or in-depth reporting of the results cannot be provided in order to protect the confidentiality of the respondents.
The numbers presented throughout the report may not add up precisely to the totals provided due to rounding. Additionally, the findings presented throughout this report are provided at current prices (i.e. unadjusted for inflation), unless otherwise stated.
About the Authors
Policy Branch
This report is produced by the Economic Analysis and Research Team, Policy Branch, at the Canadian Space Agency (CSA).
Authors
- Shazmin Kanji, Chief Economist
- Alex Dupuis, Research Analyst
- Aaron Parsons, Economist
Contact
Please send media inquiries to CSA Communications, 450-926-4370; asc.medias-media.csa@asc-csa.gc.ca.
For More Information
For more information about the Canadian space sector, or for an electronic copy of this report, please go to Publications.
Acknowledgments
The CSA wishes to acknowledge all those in the Canadian space sector who responded to the questionnaire. Without them, this report would not have been possible.
President's Message and Executive Summary

Lisa Campbell, President of the Canadian Space Agency. (Credit: CSA)
I am pleased to present the State of the Canadian Space Sector Report , which provides comprehensive analysis on the economic impact generated by the Canadian space sector. The findings in this report are based on a survey of over 200 organizations involved in space activities across Canada, including companies of all sizes, universities and research centres, as well as federal government.
This year's report highlights several promising economic trends. It reveals a dynamic sector that is driving growth, generating high-quality jobs, and advancing the most innovative technology across Canada.
Highlights from include:
- The sector is fuelling the economy now more than ever. The space sector contributed $3.8B to Canada's GDP, which is a 6% growth since last year when adjusting for inflation, and 15% growth since . This means that the sector is making an increasingly important impact on the economy at large.
- The skilled workforce continues to grow across the country. The sector supported a total of 14,622 direct jobs across Canada, a new all-time high. This workforce is considered as one of the most educated in the country, with 74% having at least a bachelor's degree, and the leading occupation being engineers and scientists (41%). The increase in the workforce has also resulted in changes to organizational composition, with some companies transitioning from medium-sized to large-sized. This is an important sign of growth in the sector and demonstrates that organizations can scale-up in the current environment.
- Revenues remained stable but non-broadcasting revenues are soaring. Revenues reached $5.0B, dropping only 1% since last year. Despite this, growth was evident in several segments. Non-broadcasting revenues were $3.6B, the highest the Canadian space sector has ever achieved, increasing over 4% since last year. Revenues in Canada's upstream segment have also shown impressive growth, reaching $1.48B, driven by a 172% increase in space systems manufacturing since .
- Investing in innovation is a clear priority within the sector. Business expenditures in research and development (BERD) reached a new peak of $962M – which is a 156% increase since . This demonstrates how companies are investing for future innovation and growth. Results in innovation are also evident as the sector generated 413 inventions and 113 patents.
- CSA development programs have a proven impact in the long term. CSA development programs invest in space organizations to build capacity in space technology. These investments help us build sovereign capabilities that improve our daily lives as well as help defend our country. Our analysis shows that for every dollar invested, three dollars and thirty cents are returned through follow-on revenues five years after a project has completed. This means we are building critical capacity in key areas that have future benefit to the broader sector.
This report demonstrates how space has become an increasingly important sector of Canada's economy. The demand for space-based solutions that are dual use, serving both civil and defence needs, is expected to grow as technology evolves and becomes even more integrated in the modern economy. The sector is investing heavily in its future and conducting rigorous research and development which has the potential to bring innovative technology to market and improve the lives of Canadians. As the economic footprint of the sector continues to grow, it is evident that Canada has the know-how, the workforce, and the experience required to be a leader in the global space sector for the long term.
I would like to convey my gratitude to all those who contributed to the survey. This publication would not be possible without the generous collaboration of members of the Canadian space industry and academia.
1 The Canadian Space Sector Landscape
In this section
Highlights
- Based on responses, the sector is made up of 75% companies (9% large, 66% SME), 20% universities and research centres, and 5% Government of Canada.
- Large companies continue to make the biggest economic impact in the sector, accounting for the largest share of revenues (79%), workforce (47%), BERD (89%), and exports (79%). There has been a decline in the impact of SMEs in revenues and workforce due to changes of organization size classification; however, SMEs are a major source of innovation, as they are responsible for 55% of inventions.
- University and research centres have lower revenues (3%) by nature but have the most educated workforce, consisting primarily of HQP and STEM employees.
The survey included responses from 212 organizations involved in space activities from across Canada. The composition of organizations is large companies (9%), small and medium-sized enterprises (SMEs) (66%), universities and research centres (20%), and government departments (5%). The unique characteristics of the private sector are demonstrated below:
| Total Revenues | Total Workforce | Total BERD | Total Exports | |
|---|---|---|---|---|
| Large Companies | $4.0B (79%) | 6,833 (47%) | $856M (89%) | $1.7B (79%) |
| SMEs | $921M (18%) | 3,094 (21%) | $106M (11%) | $459M (21%) |
| Universities & Research Centres | $130M (3%) | 2,891 (20%) | N/A | $8M (Less than 1%) |
Note *The remaining percentage of workforce can be attributed to the Government of Canada. For the definition of BERD, refer to Annex C.
Of note, there were companies whose sizes changed, making significant impacts on the economic impact when breaking down the private sector by company size when comparing to previous years.
Large Companies
There were 19 large companies that responded to the survey (defined as employing >500 workers). Although they represented only 9% of organizations, they generated the largest share of revenues, workforce, BERD, and exports in the sector. Their increased impact this year is due to the reclassification of some organizations from SME to large as a result of workforce growth.
Small and Medium-Sized Enterprises (SMEs)
There were 140 SMEs that responded to the survey (defined as employing 1 to 499 workers). Although SMEs generate less of an economic impact when compared to large companies, they account for 55% of inventions in the sector.
Universities and Research Centres
There were 42 universities and research centres across the country that responded to the survey. Contributions to overall revenues remain small, but this is expected given the research orientation of these organizations. Universities and research centres have the most educated workforce, with HQP representing 85% and STEM employees representing 96% of employees.
Canada's Leading Space Organizations
Results for Canada's top 30 space organizations (i.e. based on revenues) were similar to previous years, comprised of 27 companies and 3 universities. The results demonstrate that the sector continues to be highly concentrated as the top 30 account for the majority of revenues and workforce.
| Workforce | Inventions and Patents |
Revenues | BERD | Exports |
|---|---|---|---|---|
| 62% | 45% and 78% | 94% | 90% | 94% |
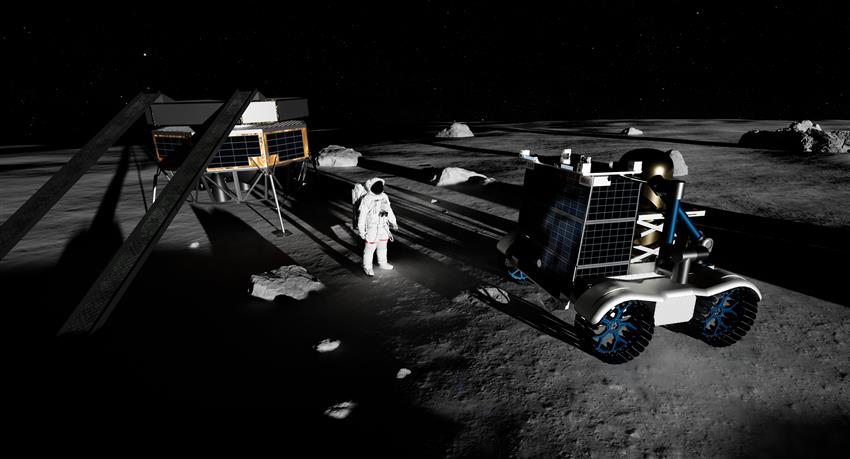
. Three Canadian companies were awarded contracts to advance the development of the Canadian lunar utility rover. This vehicle will play a key role in astronauts' work: it may be used to support operations, move cargo, perform science investigations, and handle logistics tasks on the lunar surface. (Credit: CSA/ESA)
2 Economic Impact – Gross Domestic Product
In this section
Highlights
- The space sector contributed $3.8B towards Canada's GDP in in nominal terms, up +6.3% in real growth from last year.
- From to , the space sector contribution to real GDP grew by +15.4%, with a CAGR of +2.9%.
The space sector contributed $3.8B to Canada's GDP in . This reflects a +6.3% growth in real GDP from last year. This represents the unduplicated value of goods and services produced in Canada by the space sector, and by other industries as a result of the Canadian space sector's supply chain purchases and of associated employees' consumer spending. This analysis accounts for inflation where applicable and has been backdated to ensure comparability. Further details on methodology can be found in Annex B.
Total GDP contribution was broken down into the following:
| Direct (space sector impact) | Indirect (supply industry impacts) | Induced (impacts related to consumer spending by associated employees) | Total | |
|---|---|---|---|---|
| Nominal GDP (current dollars) | $2.0B | $0.90B | $0.89B | $3.8B |
| Real GDP (adjusted for inflation and chained to 2017 dollars) | $1.58B | $0.71B | $0.70B | $3.0B |
The space sector therefore creates benefits in the larger economy with a multiplier of 1.90. In other words, every dollar that the space sector contributed to GDP resulted in an additional $0.90 in GDP contributions for the broader economy.
In fact, the real GDP impact (adjusted for inflation) of the Canadian space sector has been on an upward trajectory – showing a growing importance in the Canadian economy. From to , it increased by 15.4% ($399M), translating into a Compound Annual Growth Rate (CAGR) of 2.9%.
| Direct | 1,362 | 1,374 | 1,297 | 1,425 | 1,483 | 1,576 |
|---|---|---|---|---|---|---|
| Indirect | 626 | 628 | 579 | 644 | 665 | 713 |
| Induced | 607 | 592 | 581 | 637 | 667 | 704 |
3 Revenues Impact
In this section
Highlights
- Total revenues in the space sector declined slightly to $5.0B (-1.2%). The stability is partially associated with a divergence in the space economy, with a decline in satellite communication (and particularly in broadcasting), despite growth in all the other sectors.
- While other sectors of the space economy have experienced growth, broadcasting revenues have declined by 46% (-$1.2B) over the last decade. This has had significant effects on the downstream segment, which now totals $3.5B (71%). The upstream segment generated roughly $1.5B (29%), and this increase can be attributed mostly to space systems manufacturing.
- Domestic revenues declined to $2.9B (-2%) – influenced again by broadcasting declines and a minor drop in exports, which decreased to $2.2B (-0.4%). North America (primarily to the U.S.) continued to dominate as a destination for Canadian exports, and this dominance is growing in scale.
Total Revenues
In , total revenues in the Canadian space sector reached $5.0B, a -1.2% ($63M) decrease from last year. The CAGR of the space sector was -1.74% between and .
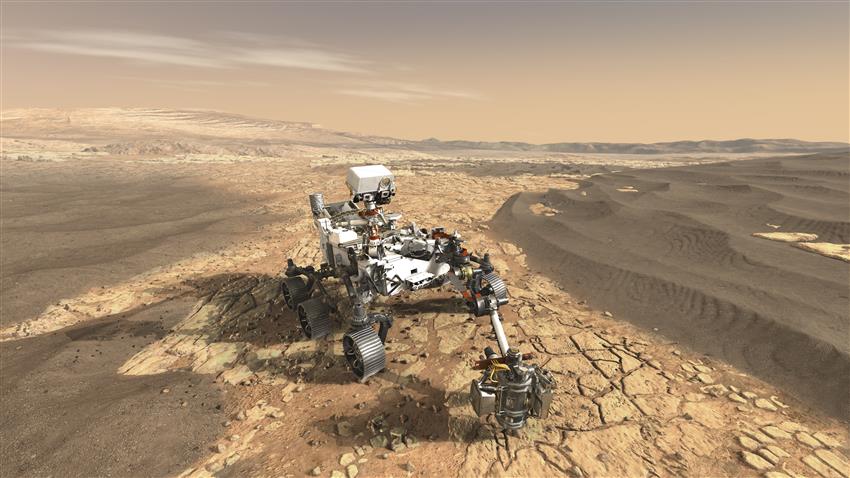
. A team of researchers, including three Canadian scientists, made a remarkable discovery when studying samples collected by NASA's Perseverance Mars rover. Through their analyses, researchers believe that they have discovered a potential "biosignature" that may suggest the presence of past or present life. (Credit: JPL-Caltech)
| Revenues | 5,489 | 4,898 | 4,896 | 5,049 | 5,091 | 5,028 |
|---|
Market Share by Customer Location
Domestic vs. Export Revenues
In , Canadian space revenues totalled $5.0B, of which 57% ($2.9B) were from domestic sources and 43% ($2.2B) were from exports. Domestic revenues decreased by 1.9%, or $55M, while exports decreased by 0.4%, or $8M.
Between and , the CAGR was -1.7% for the entire space sector, -2.2% for domestic revenues, and -1.2% for exports.
| Domestic | Exports | |
|---|---|---|
| 3,180 | 2,309 | |
| 2,996 | 1,901 | |
| 3,117 | 1,779 | |
| 3,052 | 1,997 | |
| 2,907 | 2,185 | |
| 2,851 | 2,177 |
Domestic vs. Broadcasting Revenues
The satellite communication (satcom) sector has been consistently shrinking, and this can be directly attributed to broadcasting services, which include direct-to-home television and radio services delivered by satellite. In , broadcasting accounted for 42% of the satcom sector revenues, and 29% of the total space sector revenues. Since broadcasting services represent a major share of the space economy, their ongoing decline has a considerable impact on overall revenue growth.
From to , broadcasting revenues declined by 46% (-$1.2B). Conversely, over the same period, total space revenues without broadcasting increased by 32% ($876M). Within the satcom sector itself, non-broadcasting revenues have risen by 10%. This explains why total revenues have been relatively flat over the years. The growth in all other areas, including in satcom, has not offset the large decline in broadcasting. That said, customers are turning towards alternative products, including satellite Internet-based services, which creates new opportunities for the sector.
| Total Revenues | Total Revenues without broadcasting |
Total broadcasting | |
|---|---|---|---|
| 5,383 | 2,716 | 2,667 | |
| 5,299 | 2,735 | 2,563 | |
| 5,530 | 3,079 | 2,452 | |
| 5,595 | 3,264 | 2,332 | |
| 5,671 | 3,456 | 2,215 | |
| 5,489 | 3,441 | 2,048 | |
| 4,898 | 2,895 | 2,003 | |
| 4,896 | 2,942 | 1,954 | |
| 5,049 | 3,210 | 1,839 | |
| 5,091 | 3,438 | 1,653 | |
| 5,028 | 3,592 | 1,436 |
Export Regions
In , export revenues slightly decreased, falling 0.4% and generating $2.2B in revenues. Increases were most notable in North America, while most other regions declined.
North America remained the main destination for Canadian space exports, totalling 68% of all exports. Revenues derived from exports to North America increased by 4%, or $58M, from $1.42B in to $1.48B in . It is important to note that the United States constitutes 97% of North American export revenues.
Europe remained Canada's second largest market for space exports. Canadian exports to Europe decreased by 7%, or $30M, from $424M in to $393M in . Europe accounted for 18% of total exports in , a share that may grow in future years given Canada's historic ~$664M investment at the European Space Agency's Ministerial Council in – which is a tenfold increase from previous years. Participation in ESA programs gives Canadian organizations access to major European programs, procurement opportunities, and collaborative R&D, which could translate into meaningful export activity in the years ahead.
Exports to Asia decreased the most of any region, by 22%, or $40M, from $179M in to $139M in . Asia accounted for 6% of total exports.
Exports to Central America, South America, and the Caribbean decreased by 8%, or $8.8M, from $111M in to $102M in . The region accounted for 5% of total exports.
Exports to the Middle East increased by 3%, or $0.5M, from $16.3M in to $16.7M in . This region accounted for less than 1% of total export revenues.
Exports to Oceania and Antarctica increased by 6%, or $0.9M, from $15.5M in to $16.4M in . Oceania and Antarctica accounted for less than 1% of total export revenues.
Exports to Africa decreased by 4%, or $0.5M, from $10.2M in to $9.7M in . Africa accounted for less than 1% of total Canadian space export revenues.
Finally, less than 1% of total exports, or $19M, were classified as Other and not allocated to a specific region of the world.
| North America | 68% |
|---|---|
| Europe | 18% |
| Asia | 6% |
| Central America, South America and Caribbean |
5% |
| Oceania and Antarctica | 1% |
| Middle East | 1% |
| Other | 1% |
| Africa | 0% |

. To allow Canadian space sector organizations to collaborate further with European industry and to bid on European Space Agency (ESA) contracts, the Government of Canada announced an investment of €407.71 million (approximately CAD$664.6 million) in ESA programs. In June, ESA Director General Dr. Josef Aschbacher visited Canada to sign a joint statement with CSA President Lisa Campbell, reaffirming the unique, proven, and productive partnership between Canada and ESA. (Credit: CSA)
The most notable trends in exports between and were decreases in almost every region from to due to the pandemic, followed by a massive increase to North America. Exports to North America have now reached $1.48B and are 13% ($166M) above previous highs from . The largest decline in export revenues from other regions comes from Asia, which are down to $139M, a decline of 59% ($197M) from . Europe has also experienced a decline of 12% ($56M), and Central America, South America, and the Caribbean have declined by 30% ($44M). The fluctuations in export revenues shows a trend of growing reliance on exports to North America (which is primarily the United States).
| North America | 1,314 | 1,164 | 1,046 | 1,215 | 1,422 | 1,480 |
|---|---|---|---|---|---|---|
| Europe | 449 | 402 | 408 | 436 | 424 | 393 |
| Asia | 337 | 171 | 157 | 171 | 179 | 139 |
| Central America, South America and Caribbean |
147 | 113 | 114 | 113 | 111 | 102 |
| Middle East | 16 | 21 | 28 | 32 | 16 | 17 |
| Oceania and Antarctica | 16 | 14 | 11 | 16 | 15 | 16 |
| Other | 11 | 1 | 4 | 8 | 7 | 19 |
| Africa | 20 | 16 | 11 | 6 | 10 | 10 |
Market Share by Customer Type
Customers are categorized as either government or non-government. Government customers include domestic governments (municipal, provincial, federal) and foreign governments. Non-government customers include businesses, individual consumers, and non-profit organizations or foundations (both domestic and foreign).
In , 16% ($793M) of the space revenues were derived from government customers. This includes 12.5% ($627M) from domestic government sources and 3.3% ($166M) from foreign government sources. The rest of the revenues (84%, or $4.2B) were sourced from non-government customers.
Both upstream and downstream segment organizations derived most of their revenues from non-government clients in . The upstream segment derived 66% of revenues from non-government clients, whereas the downstream segment derived 92% of revenues from non-government clients.
Market Share by Value-Chain Segments
Space sector revenues can be broken down into value-chain segments and sub-segments based on the type of work that the organization is carrying out. This analysis splits sector revenues by upstream and downstream activities.
The upstream segment includes research, engineering and consulting; space systems manufacturing; and ground systems manufacturing. In , it generated $1.48B (29%) of revenues, which is a +16% growth from last year. This increase is driven only by space systems manufacturing.
The downstream segment includes satellite operations, products and applications, and services. In , it generated $3.55B (71%) of revenues, which is a -7% decline from last year. This is attributed to a decline in revenues from Satellite Operations and Services, which lost a collective 8% ($247M) since last year.
A detailed description of the value-chain categorization is provided in Annex C.
| Upstream | 29% |
|---|---|
| Downstream | 71% |
Revenues in each sub-segment can be broken down as follows:
- Research, Engineering and Consulting amounted to $424M in , a 0.2% decrease ($1M) from . This sub-segment accounted for 8% of total revenues in .
- Space Systems Manufacturing amounted to $903M in , a 50% increase ($302M) from . It accounted for 18% of total revenues in .
- Ground Systems Manufacturing amounted to $151M in , a 38% decrease ($92M) from . It accounted for 3% of total revenues in .
- Satellite Operations amounted to $715M in , a 9% decrease ($67M) from . It accounted for 14% of total revenues in .
- Products and Applications totalled $756M in , a 3% decrease ($25M) from . It accounted for 15% of total revenues in .
- Services amounted to $2.1B in , an 8% decline ($181M) from . It accounted for 41% of total revenues in .
Market Share by Sector of Activity
Space sector revenues can also be divided into sectors of activity based on the type of work that the organization is carrying out. In , almost all sectors of the space sector experienced growth. A detailed description of the sectors of activity categorization is provided in Annex C.
Revenues for each sector of activity are as follows:
- Satellite Communication generated $3.5B in revenues in , decreasing by $140M (-4%), and accounting for 69% of total space revenues.
- Earth Observation (EO) revenues totalled $373M in , growing by $7M (+2%), and accounting for 7% of total space revenues.
- Space Exploration revenues totalled $358M in , increasing by $49M (+16%), and accounting for 7% of total space revenues.
- Navigation revenues grew to $700M in , increasing by $11M (+2%), and accounting for 14% of total space revenues.
- Space Science revenues totalled $100M in , increasing by $0.6M (+1%), and accounting for 2% of total space revenues.
- Other revenues increased by 26%, rising to $43M, and accounting for 1% of total space revenues. Activities that fall into the “Other” sector are by nature variable and subject to re-categorization; therefore, changes in this sector are less statistically relevant than for the previously noted sectors.
| Satellite Communication | 69% |
|---|---|
| Navigation | 14% |
| Space Exploration | 7% |
| Earth Observation | 7% |
| Space Science | 2% |
| Other | 1% |
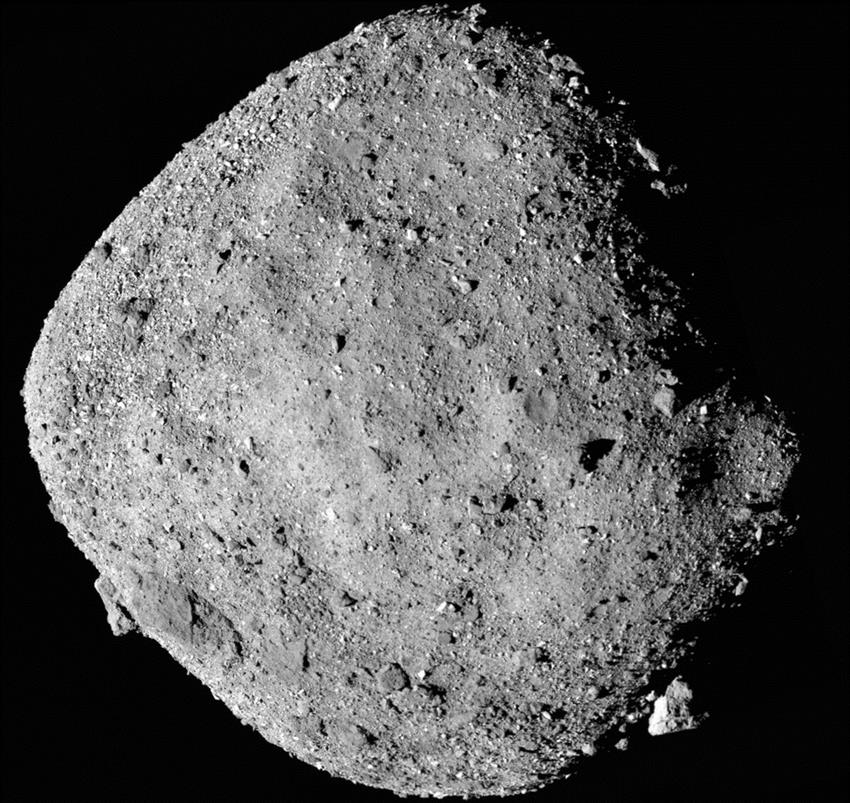
. Three scientific papers offered insights into the origins and composition of asteroid Bennu. Canadian researchers on the OSIRIS-REx international science team contributed to these studies. (Credit: NASA/Goddard/University of Arizona)
4 Workforce
In this section
Highlights
- The space workforce in Canada increased by 4.0% in to 14,622 space-related jobs – 72% of which were STEM-related jobs. The total workforce has increased 24% since .
- The space sector supported a total of 28,171 direct, indirect and induced jobs in the Canadian economy in .
- Many occupational categories have grown over the last six years: engineers and scientists (+1,818), students/interns (+711), other and health professionals (+327). Administration is the only occupation to have consistently declined year over year, which is driven only by industry.
Total Workforce
In , the Canadian space sector workforce totalled 14,622 direct jobs, a 4.0% (562 jobs) increase from last year. Since , the direct workforce has grown by almost 24%, which can largely be attributed to employment growth in the upstream.
The majority of the space sector workforce is in the private sector (88%) while the remainder is in the Government of Canada (12%). Within the private sector, 60% of the jobs are in the upstream segment, and 40% of jobs are in the downstream segment. The larger proportion of the workforce in the upstream segment can be attributed to the disproportionate contribution from Universities and Research Centres.
| Industry | 8,171 | 8,253 | 8,588 | 9,212 | 9,655 | 9,627 |
|---|---|---|---|---|---|---|
| University | 2,370 | 1,939 | 2,304 | 2,573 | 2,792 | 2,891 |
| Government of Canada | 1,263 | 1,314 | 1,400 | 1,493 | 1,613 | 1,804 |

. 25 years of international cooperation to respond to disasters: the International Charter: Space and Major Disasters, of which Canada became a founding member in 2000, aims to put space technology at the service of emergency responders in the event of major disasters. (Credit: CSA)
Economic Impact – Workforce
The space sector supported a total of 27,980 jobs in Canada. The total workforce contribution was broken down into the following:
- 14,622 direct space sector jobs; and
- 13,549 indirect and induced jobs:
- 7,153 supply industry jobs; and
- 6,396 jobs created and supported as a result of consumer spending by associated employees.
The space sector creates jobs in the broader economy with a multiplier of 1.93. In other words, every job in the space sector supports an additional 0.93 jobs in the broader economy.
From to , the workforce impact of the Canadian space sector increased by 18.2% (4,328 jobs), translating into a 3.4% CAGR. Since , this growth has been influenced more significantly by increases in direct jobs in the space sector, as the indirect and induced impacts have been more modest.
| Direct | 11,804 | 11,505 | 12,291 | 13,278 | 14,060 | 14,622 |
|---|---|---|---|---|---|---|
| Indirect | 6,443 | 6,186 | 5,945 | 6,473 | 6,741 | 7,153 |
| Induced | 5,597 | 4,962 | 5,279 | 5,723 | 6,057 | 6,396 |
Occupations
The Canadian space workforce is divided into eight main occupational categories: Engineers and Scientists, Technicians, Management, Administration, Marketing and Sales, Students , Health Professionals, and Other Employees. The composition of the workforce in was relatively unchanged, with a variability of +/-2%, similar to previous years.
| Engineers and Scientists | 41% |
|---|---|
| Administration | 17% |
| Students/Interns | 14% |
| Technicians | 10% |
| Other + Health Professionals | 8% |
| Management | 7% |
| Marketing and Sales | 3% |
While there have been minimal year-over-year changes in the space workforce composition, the trend in occupations from to displays consistent growth in many key categories. Growth was concentrated amongst engineers and scientists (+1,818), students/interns (+711), other and health professionals (+327), and management (+297). Although the technician category saw a decline and then a rise in job numbers, the six-year trend is not as significant (+168). The marketing and sales staff shows a small decline (-61), while the administration category has seen declines every year (-443). The large growth in engineers and scientists and the large decline in administration can be attributed to industry, while students/interns can be attributed to universities.
| Management | Engineers and Scientists | Technicians | Marketing and Sales | Administration | Students/ Interns | Other+ Health Professionals | |
|---|---|---|---|---|---|---|---|
| 787 | 4,143 | 1,248 | 549 | 2,912 | 1,303 | 862 | |
| 717 | 4,062 | 1,115 | 566 | 2,798 | 1,169 | 1,079 | |
| 790 | 4,537 | 1,014 | 640 | 2,737 | 1,448 | 1,126 | |
| 966 | 5,239 | 1,124 | 511 | 2,618 | 1,622 | 1,199 | |
| 1,030 | 5,624 | 1,301 | 479 | 2,577 | 1,938 | 1,111 | |
| 1,084 | 5,961 | 1,416 | 489 | 2,469 | 2,014 | 1,189 |
STEM Employees
The STEM workforce indicator tracks the number of engineers, scientists, technicians, management, health professionals and students working in the space sector. STEM employees grew +6% and totalled 10,505 jobs in , which represented 72% of the total Canadian space workforce.
Definition of STEM Employees
-
STEM = Engineers, scientists, technicians, management, health professionals, and students
There are significant differences between the upstream and the downstream segments. In , 84% of the workforce in the upstream segment were STEM, while 57% of the workforce in the downstream segment were STEM. The STEM workforce was 62% for Government of Canada employees.
Highly Qualified Personnel (HQP)
The HQP workforce indicator identifies the number of space sector employees with at minimum a bachelor's degree. HQP employees grew +5% and accounted for 10,819 jobs in , which represented 74% of Canada's space workforce.
Definition of HQP Employees
-
HQP = Employees having completed at least a bachelor's degree
The differences between HQP jobs in the upstream and the downstream segments are less pronounced than for STEM employees but are still significant. While 77% of the upstream workforce were HQP in , 71% of the downstream workforce were HQP. The HQP workforce stood at 70% for Government of Canada employees.

. Marc Garneau passed away at age 76. He was one of the first six Canadian astronauts selected in , and made history by becoming the first Canadian to go to space. His legacy continues to inspire Canadians to pursue careers in space. (Credit: NASA)
Space Labour Force Challenges and Needs
Canadian space organizations have experienced persistent challenges related to labour force needs. Although there is some improvement, approximately 43% of Canadian space companies faced hiring difficulties to the extent that positions went unfilled in .
| Proportion | 47% | 55% | 61% | 49% | 47% | 43% |
|---|
Professions with hiring difficulties continue to be engineers, scientists, technicians, and marketing and sales. The main reasons highlighted for hiring difficulties were applicants lacking the skills required for the position, followed by competition from other industrial sectors for the same talent, and a lack of relevant experience.
Companies dealing with employee shortages used three main strategies to deal with the problem: they provided internal training, offered overtime for existing employees, and/or outsourced some of the work.
Over the next five years, Canadian space companies will be looking for employees with sought-after skills related to software development, business development, applications of artificial intelligence, and electrical engineering systems. In the last few years, we have seen a steady rise in the demand for expertise in artificial intelligence.
Gender Distribution of Employees
In , the Canadian space sector workforce was primarily made up of people who identify as men (70%) and people who identify as women (30%), while people who identify as non-binary represented 0.3% of employees in the Canadian space sector.
| Total | Industry | University | Government | |
|---|---|---|---|---|
| Men | 70% | 74% | 66% | 57% |
| Women | 30% | 26% | 33% | 43% |
| Non-binary people | 0.26% | 0.21% | 0.55% | 0.06% |
Notably, the government workforce had the highest composition of women, followed by universities. Non-binary people had the highest representation at universities, while the industry segment of the space economy had the highest representation of men.
5 Regional Distribution and Trends
In this section
Highlights
- The composition of revenues and workforce between regions stayed relatively consistent.
- Revenues decreased for every region except Quebec, which continued its upward trajectory after the pandemic. The largest shifts occurred in the Prairies (-14%), Quebec (+10%), and the Atlantic (-8%).
- Employment grew in every region over the last year, with the Atlantic (+8%), Ontario (+7%) and B.C. and North (+6%) seeing the largest growth.
In , the proportional share of total revenues and employment by province remained relatively stable (±3%) from year to year.
| B.C. and North | 4% |
|---|---|
| Prairies | 10% |
| Ontario | 53% |
| Quebec | 29% |
| Atlantic | 4% |
Revenues and Workforce by Region
British Columbia and North
- Revenues: $183M (4%) of total space revenues, a decrease of 4% ($9M) from .
- Workforce: 6% (914 jobs) of Canada's space workforce, an increase of 6% (48 jobs) from .
Between and , total revenues increased by 13%, which was driven by a surge in domestic revenues by 79%. Over the same period, export revenues declined (-27%).
Note: The North (Yukon, Northwest Territories and Nunavut) is integrated with British Columbia due to the small number of responses.
Prairies (Alberta, Saskatchewan and Manitoba)
- Revenues: $489M (10%) of total space revenues, a decrease of 14% ($81M) from .
- Workforce: 14% (2,001 jobs) of Canada's space workforce, an increase of 2% (42 jobs) from .
Between and , total revenues grew by 33%, primarily driven by a surge in domestic revenues by 134%. Exports grew 17% in the same period.
Ontario
- Revenues: $2.67B (53%) of total space revenues, a decrease of 3% ($91M) from .
- Workforce: 41% (5,949 jobs) of Canada's space workforce, an increase of 7% (377 jobs) from .
Total revenues in Ontario decreased by 17% between and . Domestic and export revenues declined 14% and 22% over the same period, respectively. Revenues in Ontario are continuing to decline from pre-pandemic levels and are influenced by the decline in broadcasting.
Quebec
- Revenues: $1.47B (29%) of total space revenues, an increase of 10% ($135M) from .
- Workforce: 35% (5,066 jobs) of Canada's space workforce, an increase of 1% (41 jobs) from .
Between and , Quebec's total revenues increased by 13%, which has largely been driven by robust growth in exports (+90%), while domestic revenues declined 9% over the same time period.
Atlantic (New Brunswick, Newfoundland and Labrador, Nova Scotia and Prince Edward Island)
- Revenues: $215M (4%) of total space revenues, a decrease of 8% ($18M) from .
- Workforce: 5% (692 jobs) of Canada's space workforce, an increase of 8% (54 jobs) from .
Between and , total revenues in the Atlantic region declined by 50%. This is explained by a decline in both exports (-55%) and domestic revenues (-46%). Multiple organizations in the Atlantic region have seen declines in recent years, explaining the significant impacts on revenues for the region.
Further regional workforce composition details on Gender, STEM, and HQP can be found in Annex A.
| B.C. and North | Prairies | Ontario | Quebec | Atlantic | |
|---|---|---|---|---|---|
| Percentage | 13% | 33% | -17% | 13% | -50% |

2025-11-26. Artemis II: CSA astronaut Jeremy Hansen came to Canada for his last visit before the historic mission that will take him around the Moon. He met with many students and made a stop in Toronto, where he participated in the launch of the e-book The Explorers Club: To the Moon! (Credit: CSA)
6 Innovation
In this section
Highlights
- Business Expenditures on R&D (BERD) increased by 48%, from a previous all-time high of $650M in to $962M in . This marks a new all-time high.
- R&D intensity for space manufacturing was 17 times higher than the average for manufacturing in Canada.
- Return on Investment (ROI) for CSA space development programs after five years is 3.3 : 1.
- Space sector organizations reported a total of 413 inventions and 113 registered patents, demonstrating significant growth in inventions and a slight decrease in patents.
Business Expenditures on R&D (BERD) (Companies Only)
In , there were 105 companies engaged in R&D activities, with BERD reaching $962M. This represents a 48% increase from the $650M spent in BERD in , and a 156% increase since . SMEs accounted for 11% of BERD in , while large firms made up the remaining portion (89%). Upstream organizations were responsible for 29% of total space sector BERD, while downstream organizations represented the bulk of investments at 71% of total space sector BERD.
R&D spending in was financed through internal sources (e.g. company profits reinvested in R&D) at 77% ($742M), while the remaining 23% ($220M) was financed through external funding sources (e.g. government grants and contributions).
| Large Firms | 89% |
|---|---|
| SMEs | 11% |
| Upstream BERD | 29% |
|---|---|
| Downstream BERD | 71% |
The trend in BERD over the past six years has seen dramatic increases from internal sources in the private sector, while external funding has been increasing at a lower rate.
| 2019 | 2020 | 2021 | 2022 | 2023 | 2024 | |
|---|---|---|---|---|---|---|
| R&D Expenditures (Externally-Funded) | 161 | 174 | 133 | 124 | 187 | 220 |
| R&D Expenditures (Internally-Funded) | 214 | 306 | 414 | 469 | 463 | 742 |
R&D Intensity Level (Companies Only)
The industrial R&D intensity indicator reflects the ratio of BERD spending relative to the GDP contribution of the space sector. It serves as an indicator of the level of effort and investment by a company (or by an industry as a whole) in innovative activities such as the creation of new products, services and technologies, or the improvement of business functions such as production techniques. Industrial R&D intensity for companies operating in the space sector was 64% in . The upstream segment is less R&D intensive than the downstream: upstream R&D intensity is 39%, while downstream R&D intensity is 88%.
The R&D intensity for the manufacturing sub-segment (in the upstream) is 55%, which is 17 times higher than the average for manufacturing in Canada.
Return on Investment
For the past eight years the CSA has been surveying companies to determine the return on investment (ROI) from CSA space development programs. On average, CSA space development program investments see an ROI of 3.3 : 1, five years after the completion of the project. This means that for every dollar invested, the sector generates $3.30 in additional revenue.
This demonstrates that CSA space development programs continue to generate meaningful follow-on business revenues for participating organizations, reflecting a strong industry demand and capacity for these programs. It is also important to note that the ROI estimate is conservative in nature, as projects without successive year responses are assumed to have zero follow-on revenue. This means the actual ROI may be higher in practice and has the potential to grow over time as additional data become available.
Inventions and Patents (All Organizations)
In , the number of organizations reporting having made an invention was 74 (+9%) and registering a patent was 23 (+5%) compared to . Between and , the number of organizations with inventions increased by 30% (from 57 to 74), while the number of organizations registering patents decreased by 8% (from 25 to 23).
There has been a significant increase in activity related to inventions and patents after being flat from to . The number of inventions climbed to 413 in , a +21% increase in the last year and a +70% increase from . Registered patents decreased to 113 in , a -16% drop in the past year and a +71% increase since .
| Inventions | 243 | 215 | 226 | 256 | 340 | 413 |
|---|---|---|---|---|---|---|
| Patents | 66 | 64 | 76 | 63 | 135 | 113 |
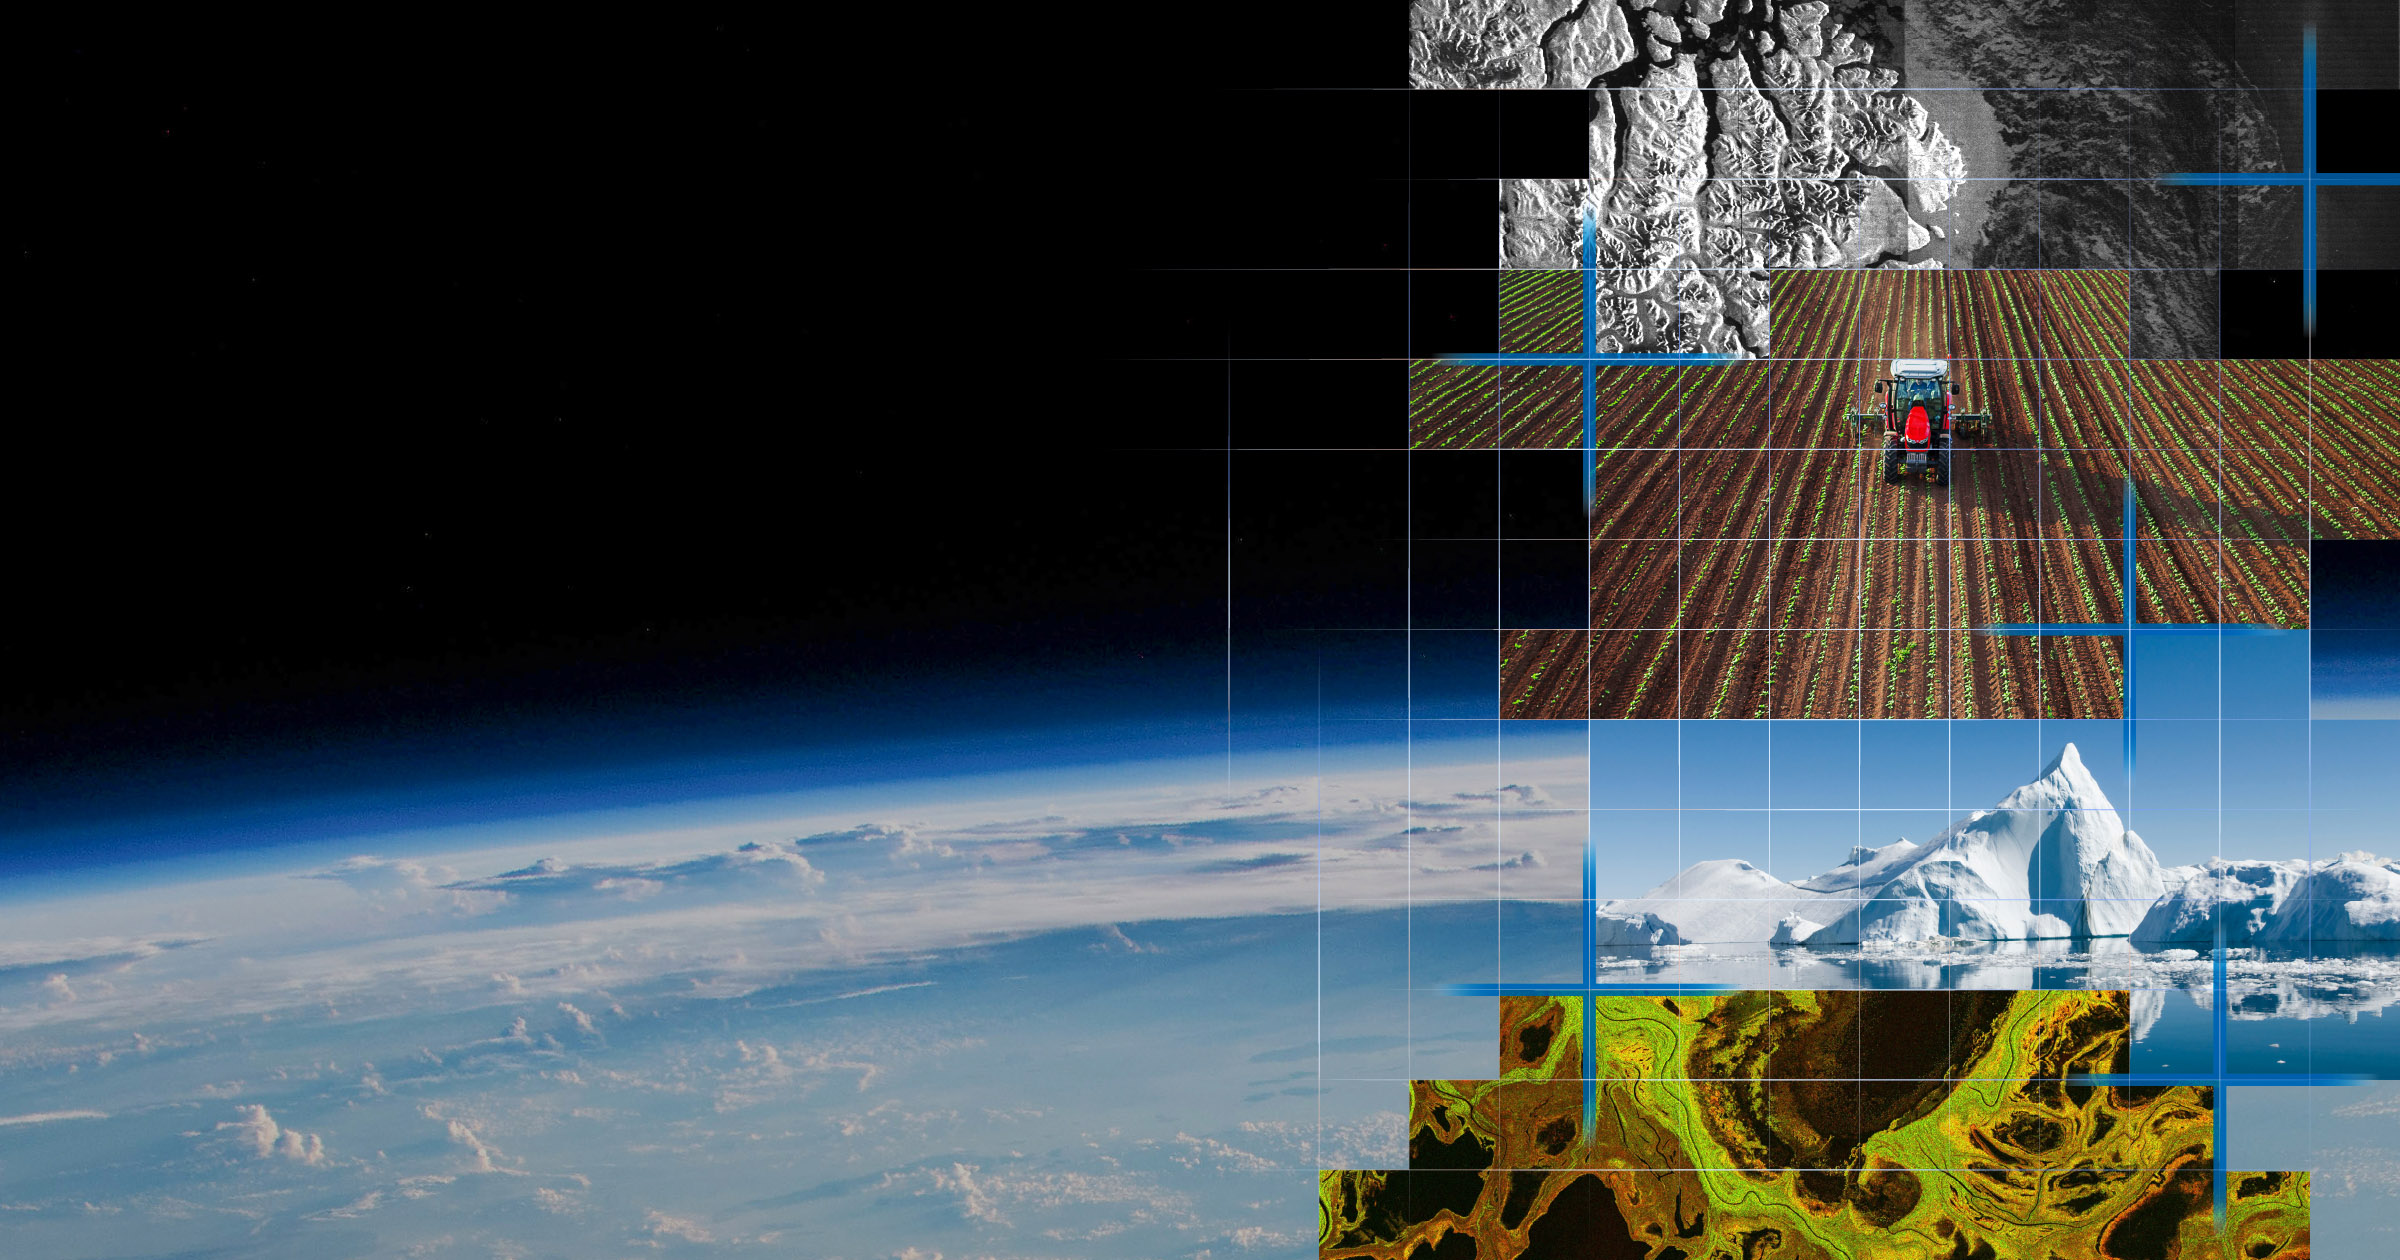
. During this year, where we celebrated the 30th anniversary of the RADARSAT program, a major investment was announced to maintain uninterrupted access to satellite data and to develop next-generation satellites. (Credit: CSA)
7. Conclusion
The Canadian space sector showed lots of signs of economic strength in . Economic output reached a new record of $3.8B, demonstrating the growing importance of the sector to the economy. Revenues slightly declined by 1.2% to reach $5.0B in . This can be mostly attributed to domestic revenues, as they decreased by 1.9%, while exports only decreased by 0.4%. The decline in revenues was only experienced by the satellite communication sector (due to broadcasting), as all other sectors experienced a growth in revenues over the last year. Workforce continued to increase, reaching 14,622 jobs, as growth was experienced in the government, industry and university workforces. BERD surged to $962M, growing by 48% from last year's peak.
Through this report, it is evident that the space economy is making important contributions to the broader Canadian economy. Growing and diversifying Canada's space sector will help meet the country's needs and respond to increasing global demand for space solutions and services.
Annex A: Economic Trends: –
| YEAR | TOTAL REVENUES |
|---|---|
| 5,489 | |
| 4,898 | |
| 4,896 | |
| 5,049 | |
| 5,091 | |
| 5,028 |
| Domestic | Domestic % | Exports | Exports % | Total | |
|---|---|---|---|---|---|
| 3,180 | 58% | 2,309 | 42% | 5,489 | |
| 2,996 | 61% | 1,901 | 39% | 4,898 | |
| 3,117 | 64% | 1,779 | 36% | 4,896 | |
| 2022 | 3,052 | 60% | 1,997 | 40% | 5,049 |
| 2023 | 2,907 | 57% | 2,185 | 43% | 5,091 |
| 2024 | 2,851 | 57% | 2,177 | 43% | 5,028 |
| Public Revenues | Private Revenues | |
|---|---|---|
| 342 | 2,839 | |
| 318 | 2,678 | |
| 392 | 2,725 | |
| 428 | 2,623 | |
| 583 | 2,323 | |
| 627 | 2,224 |
| North America | 1,314 | 1,164 | 1,046 | 1,215 | 1,422 | 1,480 |
|---|---|---|---|---|---|---|
| Europe | 449 | 402 | 408 | 436 | 424 | 393 |
| Asia | 337 | 171 | 157 | 171 | 179 | 139 |
| Africa | 20 | 16 | 11 | 6 | 10 | 10 |
| Other | 11 | 1 | 4 | 8 | 7 | 19 |
| Central America, South America, and the Caribbean | 147 | 113 | 114 | 113 | 111 | 102 |
| Middle East | 16 | 21 | 28 | 32 | 16 | 17 |
| Oceania and Antarctica | 16 | 14 | 11 | 16 | 15 | 16 |
| Total | 2,309 | 1,901 | 1,779 | 1,997 | 2,185 | 2,177 |
| Satellite Communication |
Navigation (GPS) | Space Exploration |
Earth Observation |
Space Science |
Other | |
|---|---|---|---|---|---|---|
| 4,563 | 418 | 119 | 248 | 111 | 31 | |
| 3,998 | 421 | 132 | 226 | 90 | 31 | |
| 3,891 | 440 | 164 | 270 | 94 | 37 | |
| 3,779 | 550 | 231 | 349 | 101 | 38 | |
| 3,595 | 688 | 308 | 366 | 100 | 34 | |
| 3,455 | 700 | 358 | 373 | 100 | 43 |
| Total Workforce | STEM | HQP | |
|---|---|---|---|
| 11,804 | 7,502 | 7,849 | |
| 11,505 | 7,085 | 7,396 | |
| 12,291 | 7,811 | 8,303 | |
| 13,278 | 8,969 | 9,140 | |
| 14,060 | 9,918 | 10,258 | |
| 14,622 | 10,505 | 10,819 |
| B.C. & North | 739 | 746 | 809 | 733 | 866 | 914 |
|---|---|---|---|---|---|---|
| Prairies | 1,116 | 1,109 | 1,324 | 1,566 | 1,960 | 2,001 |
| Ontario | 5,065 | 4,621 | 4,877 | 5,248 | 5,572 | 5,949 |
| Quebec | 4,089 | 4,287 | 4,514 | 4,812 | 5,024 | 5,066 |
| Atlantic | 795 | 742 | 768 | 919 | 638 | 692 |
| Domestic | Exports | Domestic | Exports | |
|---|---|---|---|---|
| B.C. & North | 61 | 102 | 108 | 75 |
| Prairies | 51 | 317 | 118 | 371 |
| Ontario | 1,832 | 1,393 | 1,582 | 1,090 |
| Quebec | 1,015 | 287 | 922 | 546 |
| Atlantic | 222 | 209 | 120 | 95 |
| Total | 5,489 | 5,028 | ||
| B.C. & North | 163 | 165 | 184 | 193 | 192 | 183 |
|---|---|---|---|---|---|---|
| Prairies | 368 | 386 | 396 | 466 | 570 | 489 |
| Ontario | 3,225 | 2,785 | 2,703 | 2,760 | 2,764 | 2,672 |
| Quebec | 1,302 | 1,188 | 1,251 | 1,301 | 1,334 | 1,468 |
| Atlantic | 431 | 373 | 361 | 328 | 233 | 215 |
| Management | Engineers & Scientists | Technicians | Marketing and Sales | Administration | Students/ Interns |
Other – including health professionals | Total | |
|---|---|---|---|---|---|---|---|---|
| 2019 | 782 | 4,143 | 1,248 | 549 | 2,912 | 1,303 | 862 | 11,804 |
| 2020 | 717 | 4,062 | 1,115 | 566 | 2,798 | 1,169 | 1,079 | 11,505 |
| 2021 | 790 | 4,537 | 1,014 | 640 | 2,737 | 1,448 | 1,126 | 12,291 |
| 2022 | 966 | 5,239 | 1,124 | 511 | 2,618 | 1,622 | 1,199 | 13,278 |
| 2023 | 1,030 | 5,624 | 1,301 | 479 | 2,577 | 1,938 | 1,111 | 14,060 |
| 2024 | 1,084 | 5,961 | 1,416 | 489 | 2,469 | 2,014 | 1,189 | 14,622 |
| Management | Engineers & Scientists | Technicians | Marketing and Sales | Administration | Students/ Interns |
Other (including health professionals) | Total | |
|---|---|---|---|---|---|---|---|---|
| B.C. & North | 67 | 456 | 108 | 41 | 49 | 137 | 56 | 914 |
| Prairies | 167 | 822 | 259 | 23 | 23 | 642 | 66 | 2,001 |
| Ontario | 521 | 2,653 | 538 | 211 | 757 | 582 | 688 | 5,949 |
| Quebec | 261 | 1,911 | 393 | 135 | 1,561 | 554 | 251 | 5,066 |
| Atlantic | 69 | 120 | 118 | 79 | 79 | 99 | 128 | 692 |
| Total | 1,084 | 5,961 | 1,416 | 489 | 2,469 | 2,014 | 1,189 | 14,622 |
| Men | Women | Non-binary people | Total | |
|---|---|---|---|---|
| B.C. & North | 73% | 26% | 0,8% | 100% |
| Prairies | 71% | 29% | 0.3% | 100% |
| Ontario | 74% | 26% | 0.4% | 100% |
| Quebec | 66% | 34% | 0.0% | 100% |
| Atlantic | 66% | 34% | 0.2% | 100% |
| Total Workforce | Total STEM | % of STEM Relative to Total Regional Workforce | % of STEM Relative to Total Number of STEM in Canada's Space Workforce | |
|---|---|---|---|---|
| B.C. & North | 914 | 768 | 84% | 7% |
| Prairies | 2,001 | 1,901 | 95% | 18% |
| Ontario | 5,949 | 4,308 | 72% | 41% |
| Quebec | 5,066 | 3,122 | 62% | 30% |
| Atlantic | 692 | 406 | 59% | 4% |
| Total | 14,622 | 10,505 | - | 100% |
| Total Workforce | Total HQP | % of HQP Relative to Total Regional Workforce | % of HQP Relative to Total Number of HQP in Canada's Space Workforce | |
|---|---|---|---|---|
| B.C. & North | 914 | 797 | 87% | 7% |
| Prairies | 2,001 | 1,551 | 78% | 14% |
| Ontario | 5,949 | 4,517 | 76% | 42% |
| Quebec | 5,066 | 3,545 | 70% | 33% |
| Atlantic | 692 | 409 | 59% | 4% |
| Total | 14,622 | 10,819 | - | 100% |
| Upstream | Downstream | ||||||||
|---|---|---|---|---|---|---|---|---|---|
| Research, Engineering and Consulting | Space Systems Manufacturing | Ground Systems Manufacturing | Satellite Operations | Value-Added Products and Applications | Services | Upstream | Downstream | Total | |
| Satellite Communication | 47 | 686 | 117 | 621 | 337 | 1,647 | 850 | 2,605 | 3,455 |
| Navigation (GPS) | 8 | 0 | 0 | 0 | 362 | 330 | 8 | 692 | 700 |
| Space Exploration | 225 | 72 | 1 | 5 | 1 | 53 | 298 | 59 | 358 |
| Earth Observation | 65 | 91 | 31 | 85 | 53 | 47 | 187 | 186 | 373 |
| Space Science | 71 | 22 | 1 | 3 | 2 | 2 | 94 | 7 | 100 |
| Other | 8 | 32 | 1 | 0 | 1 | 0 | 42 | 1 | 43 |
| Total | 424 | 903 | 151 | 715 | 756 | 2,079 | 1,478 | 3,550 | 5,028 |
Annex B: Methodology
In this section
Questionnaire
In order to measure the changes taking place in Canada's space sector each year, the CSA uses a questionnaire to collect baseline data. Questionnaires are sent to private sector enterprises, not-for-profit organizations, research centres and universities in Canada that engage in space activities. The questionnaire follows a census model and therefore aims to be as inclusive and exhaustive as possible. It has been conducted annually since .
Most organizations that responded to the questionnaire reported on a fiscal year (generally ending ), with the remainder reporting on a calendar year, from to . As in previous years, the questionnaire had a high response rate covering 212 organizations, including all major space players.
For the first time, the CSA collected data from organizations on supply chain and international space-related purchases (imports). This information will be collected for several years before it is reported on to ensure data quality.
Additionally, the CSA performs quality control measures on the survey data to ensure the accuracy of the findings.
Attribution
Data are also supplemented based on CSA transfer payments (Contracts, Grants, and Contributions) in cases where this information has not been included as part of the survey responses to more fully capture revenues.
In addition, there is a limited number of cases where data are compiled from publicly disclosed reports (e.g. for publicly traded companies) and verified through consultation with company officials.
Economic Trends
The economic trend analysis for this report assesses the past six years (–). For information on the economic trends prior to , readers are invited to consult previous editions of this report.
Economic Impact Analysis
As described in the OECD's Handbook on Measuring the Space Economy: 2nd Edition, measuring economic impacts in the space sector is a challenging task, as there is no single statistical/industrial classification for space activities. In order to overcome this difficulty, a model was developed jointly by the CSA and Innovation, Science and Economic Development Canada to calculate the space sector's contribution to GDP (gross domestic product or value added). This process involved taking into account the various industrial classifications, weighting them and categorizing them using a value-chain approach, in order to develop a set of multipliers based on Statistics Canada's Input-Output tables. These multipliers are used to determine the impacts on GDP and employment of the space sector, the suppliers to the space sector, and the consumer spending by employees associated with both the space sector and its supply industry.
A detailed explanation of the Economic Impact Model follows:
- North American Industry Classification System (NAICS) codes were retrieved for each space company through Statistics Canada's Business Register.
- Canadian space companies were categorized into a value-chain model based on the goods and services they provide.
- Universities, research centres and associations were grouped together under Research, Engineering and Consulting, as in most cases their space sector activities are related to R&D.
- The grouping of NAICS codes in each of the value-chain categories were weighted for their relative categories. Weighting was established on the basis of workforce.
- Economic multipliers were then built for each value-chain category based on Statistics Canada's input-output accounts (using NAICS codes), divided into three levels: space sector, supply industry and consumer spending.
- Employment levels for each space value-chain segment are entered in the Economic Impact Model. The economic multipliers are then applied to generate the space sector's total GDP and workforce impact numbers.
Annex C: Definitions
In this section
Canada's Space Sector
The Canadian space sector is defined as organizations (private, public and academic) whose activities include the development and use of space assets and/or space data.
Space Value-Chain Categories
This report uses a methodology developed by the Organisation for Economic Co-operation and Development's (OECD) Space Forum to characterize Canadian space activities on the basis of a value-chain approach.
This means data have been organized into categories that align with the stages of producing space goods and services: Research, Engineering and Consulting; Space Systems Manufacturing; Ground Systems Manufacturing; Satellite Operations; Products and Applications; and Services.
Upstream Segment
The upstream segment refers to the effort required to design, test, build, integrate, and launchFootnote 1 assets into space.
- Research, Engineering and Consulting: Research and development (R&D) related to non-commercial or pre-commercial activities; applied science; design and testing of spacecraft, satellites and payloads or components thereof; support services directed at enabling other space sector actors throughout the value chain, including outreach activities, legal services, insurance provision, market research, policy and management services.
- Space Systems Manufacturing: Building and integration of spacecraft, satellites, payloads or any component thereof.
- Ground Systems Manufacturing: Building and integration of facilities and equipment on Earth for satellite operations, often known as "ground stations."
Downstream Segment
The downstream segment refers to the effort required for the day-to-day operation of space assets, manufacturing of products and software applications that transform space data and signals into useful end products, and services provided to end-users.
- Satellite Operations: Day-to-day management of satellites and spacecraft once they are in space, e.g. telemetry, tracking and command; monitoring, recovery operations and collision avoidance; mission planning for satellite passes; uplinks and downlinks for signal processing to reception facility; lease or sale of satellite capacity.
- Products and Applications: Manufacturing/development of software or hardware that enable the transformation of space-derived resources into a usable/useful format, e.g. computer software applications, chipsets, Very Small Aperture Terminals and other terminals, antennas, satellite phones, video and audio receivers-decoders, and GPS devices. This category also includes publishing digital or print books, atlases and maps using space-based data.
- Services: Provision of services which are dependent on space-based signals or data to various end-users (individual consumers, government departments, or businesses), e.g. subscriptions to satellite radio, phone, television or Internet services; engineering, architectural and environmental consulting based on the processing and analysis of Positioning, Navigation and Timing (PNT) or Earth Observation data; support services provided to users of space-based products and applications, such as provision of computer consulting and facilities management, data processing, Web hosting and portals, and streaming services.
Sectors of Activity
The activities of space organizations can also be broken down, as has been done in previous reports, according to the ultimate use or purpose of the research carried out or the goods and services produced. Space sector activities can serve commercial, civil or military purposes, and refer to activities across the value chain:
- Navigation: The development and use of satellites for localization, positioning and timing services. Navigation is used for air, maritime and land transport, or the localization of individuals and vehicles. It also provides a universal referential time and location standard for a number of systems.
- Satellite Communication: The development and use of satellites to send signals to Earth for the purpose of fixed or mobile telecommunications services (voice, data, Internet, and multimedia) and broadcasting (TV and radio services, video services, Internet content).
- Earth Observation: The development and use of satellites to measure and monitor Earth (including its climate, environment and people) for a number of purposes such as resource management, mineral exploration, disaster assessment, security and defence.
- Space Exploration: The development and use of crewed and uncrewed spacecraft (space stations, rovers and probes) to investigate the reaches of the universe beyond Earth's atmosphere (e.g. the Moon, other planets, asteroids). The International Space Station and astronaut-related activities are considered in this sector.
- Space Science: The various science fields that relate to space flight or any phenomena occurring in space or on other planets (e.g. astrophysics, planetary science, space-related life science).
- Other: Generic technologies or components that are not destined for use on a specific space system or for a specific space application. This could be the case for early-phase research, small off-the-shelf components used in various systems, or services based on integrated applications. This category also captures launch activities.
Return on Investment (ROI)
ROI is defined as the ratio rate of return between net income and investment.
Jobs
Jobs impact is reported on an annual average basis and measured in terms of full-time equivalent (FTE) employment.
Highly Qualified Personnel (HQP)
HQP is defined as space-related employees who have at least a bachelor's degree. This definition aligns with Statistics Canada's definition of HQP, enabling comparisons with other sectors of the economy.
Science, Technology, Engineering, and Mathematics (STEM) Employees
STEM employees are space-related employees involved in science, technology, engineering or mathematics activities. For the purpose of this survey, STEM employees include engineers, scientists, technicians, management, health professionals and students working in the space sector. Management employees are included in the STEM indicator because the vast majority of employees in this category are managing STEM-related activities. Similarly, students were included in this indicator, because the vast majority of students employed by space companies are directly involved in STEM activities. This approach aligns more closely with Statistics Canada's and the OECD's definitions of STEM employees.
Government of Canada Employees
The report now includes data on Government of Canada employees as members of the space sector. For consistency in location, it has been assumed that outside of the CSA, Government of Canada employees are in Ontario (Ottawa). Data related to employees have also been backdated to be consistent with trend analyses throughout the report.
Business Expenditures on Research and Development (BERD)
BERD measures the spending towards R&D activities in a company. The source of funds could include their own internal private investment (cash on hand, debt, private injection) or external funding sources (government funding, other).